Dashboards to Use on Palo Alto Networks for Effective Management
Enterprises should expect to see more cyberattacks launched against them. The data that they now gather and store have made their infrastructures key targets for hackers.
Customer data and intellectual property can be sold in the black market for profit, and sensitive information can also be used by hackers to extort them.
Enterprises are now aggressively shifting their workloads to the cloud which, while it has many benefits, expands their defensive perimeter and exposes them to further risks as well.
As such, organizations are now widely investing in various security solutions in order to comprehensively protect their networks. Gartner expects security spending to exceed $124 billion this year. Solutions such as firewalls and threat prevention tools have increasingly become essential for enterprises.
Leading firewall provider Palo Alto Networks, for example, provides companies with various measures to protect their infrastructures. It's currently being used by tens of thousands of enterprise customers.
However, while the protection the service gives administrators much respite from security concerns, administrators still need to stay on top of their infrastructures.
Fortunately, users are also able to tap into available integrations with other security solutions to gain additional functionalities. Log management solution XpoLog, for instance, can be integrated with solutions like Palo Alto Networks.
This integration allows administrators to use XpoLog to intelligently analyze security services' logs to reveal patterns and discover potential anomalies in their network activities. Insights from these analyses could expose threats and vulnerabilities for administrators to address.
Through the integration, XpoLog can also generate various insightful dashboards that effectively show the state of their networks' security. Here are seven XpoLog dashboards that IT teams can readily check to make sense of their use of Palo Alto Networks' service.
Excessive network requests may indicate attack attempts. The dashboard may even affirm that certain countries are common origins of attacks, and administrators may consider applying geo-restrictions, especially if there's no upside in allowing traffic from these countries.
Knowing the sources and targets of attacks allows administrators to readily work on these machines or endpoints to prevent further spread of malicious activities throughout the network.
Often, they reuse previously compromised account credentials. Should they be able to use administrator accounts, they will be able to cause further disruption by deleting legitimate users or creating other dummy accounts.
As such, it's possible for companies to consider better credential policies or implement measures such as single-sign-on to simplify login processes. Multiple failed attempts on one or more accounts can indicate something worse, such as brute force attacks trying to gain access to these accounts.
The great thing about solutions like Palo Alto Networks is that they comprehensively log the activities on their protected networks.
Fortunately, the usefulness of such information can be further enhanced by integrating log analysis solutions. Using such tools, administrators can dive deeper into activity data and seek out patterns that are typically obscured by logs' lack of structure.
Patterns that are detected and discovered through such analyses may reveal critical anomalies that demand immediate attention.
Ultimately, the insights that these dashboards and analyses provide are extremely helpful to administrators as they allow timely and accurate action to be made when mitigating or responding to cyberattacks.
Customer data and intellectual property can be sold in the black market for profit, and sensitive information can also be used by hackers to extort them.
Enterprises are now aggressively shifting their workloads to the cloud which, while it has many benefits, expands their defensive perimeter and exposes them to further risks as well.
As such, organizations are now widely investing in various security solutions in order to comprehensively protect their networks. Gartner expects security spending to exceed $124 billion this year. Solutions such as firewalls and threat prevention tools have increasingly become essential for enterprises.
Leading firewall provider Palo Alto Networks, for example, provides companies with various measures to protect their infrastructures. It's currently being used by tens of thousands of enterprise customers.
However, while the protection the service gives administrators much respite from security concerns, administrators still need to stay on top of their infrastructures.
Fortunately, users are also able to tap into available integrations with other security solutions to gain additional functionalities. Log management solution XpoLog, for instance, can be integrated with solutions like Palo Alto Networks.
This integration allows administrators to use XpoLog to intelligently analyze security services' logs to reveal patterns and discover potential anomalies in their network activities. Insights from these analyses could expose threats and vulnerabilities for administrators to address.
Through the integration, XpoLog can also generate various insightful dashboards that effectively show the state of their networks' security. Here are seven XpoLog dashboards that IT teams can readily check to make sense of their use of Palo Alto Networks' service.
1 - Total bandwidth
Administrators can use this dashboard to check the total bandwidth that's been sent and received over the network. Knowing this helps establish baselines on what can be considered normal bandwidth consumption. For example, increased traffic during business hours should be expected. However, excessive bandwidth usage, especially during off-hours, may warrant further investigation as it may indicate potential breach attempts or distributed denial-of-service (DDoS) attacks.2 Sessions
The sessions dashboard provides information on how many sessions each user has created within the network and the key reasons why these sessions have been terminated. Session tracking essentially points out how the service mitigates certain actions. For example, it checks whether a session ended because it matched a particular security policy or because a threat has been detected.3 - User distribution
User distribution shows how many source and target users are available in the network and who the most active users are over time. Users that are unusually active relative to what they're working on could indicate that their accounts or devices may be compromised.4 - Geo distribution
The geo-distribution dashboard displays the prominent source and target countries with respect to the sending and receiving of network requests. It also displays which countries have the largest number of users and what IP addresses they use.Excessive network requests may indicate attack attempts. The dashboard may even affirm that certain countries are common origins of attacks, and administrators may consider applying geo-restrictions, especially if there's no upside in allowing traffic from these countries.
5 - Threats
Known attacks in the network can also be displayed through the threats dashboard. The information is split according to attack types grouped into categories. The number of attack instances are also displayed along with the number of victims in each category.Knowing the sources and targets of attacks allows administrators to readily work on these machines or endpoints to prevent further spread of malicious activities throughout the network.
6 - User management
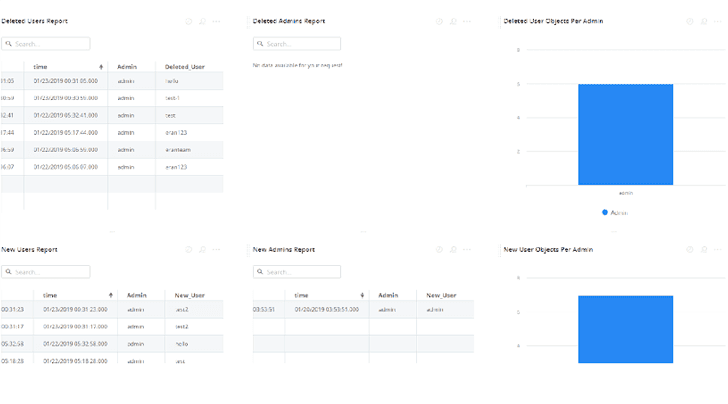
The user management dashboard displays information on the creation and deletion of user and administrator accounts in the console. It's critical to observe such activities since hackers look to obtain administrative access to networks.Often, they reuse previously compromised account credentials. Should they be able to use administrator accounts, they will be able to cause further disruption by deleting legitimate users or creating other dummy accounts.
7 - Login and logout statistics
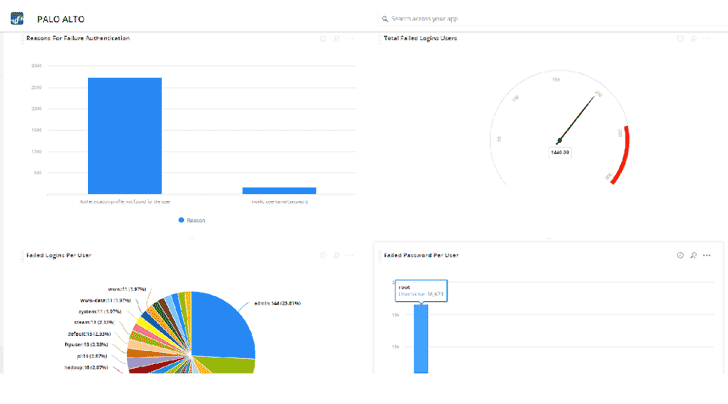
Login and logout statistics display failed login attempts, how many users faced login failure over time, and the reasons for such failed attempts. A failed attempt can be an indicator of users simply forgetting their credentialsa common occurrence in organizations.As such, it's possible for companies to consider better credential policies or implement measures such as single-sign-on to simplify login processes. Multiple failed attempts on one or more accounts can indicate something worse, such as brute force attacks trying to gain access to these accounts.
From Insights to Action
The great thing about solutions like Palo Alto Networks is that they comprehensively log the activities on their protected networks.
Fortunately, the usefulness of such information can be further enhanced by integrating log analysis solutions. Using such tools, administrators can dive deeper into activity data and seek out patterns that are typically obscured by logs' lack of structure.
Patterns that are detected and discovered through such analyses may reveal critical anomalies that demand immediate attention.
Ultimately, the insights that these dashboards and analyses provide are extremely helpful to administrators as they allow timely and accurate action to be made when mitigating or responding to cyberattacks.


